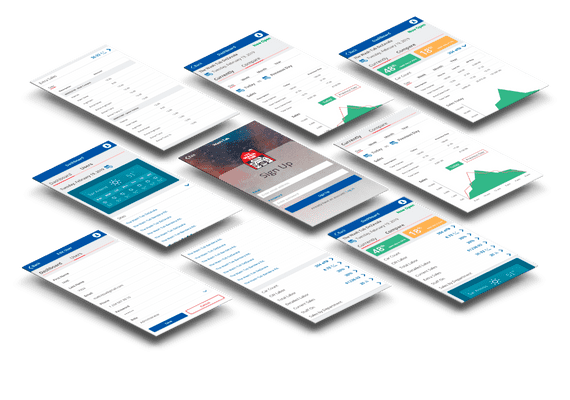
REPORTING APP


The company – a retail chain with multiple locations – wanted to receive real-time reports for employees of 25 retail locations however was using a legacy software operating system.
With the latest tech stack, we developed a reporting app with GraphQL API. The app pulls the required data from the legacy Microsoft SQL database which contains POS data.
As a result, a set of management real-time reports was created and powered by Node.JS and React framework. Now site managers can see sales and other key figures in each of 25 locations in real-time on their mobile phone.
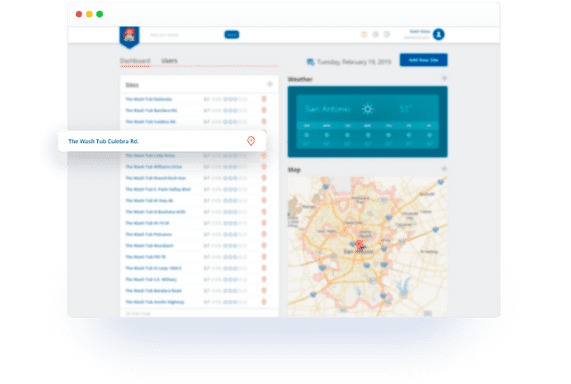
Admin Dashboard
This first dashboard gives you a high level of information. This user-friendly table has a list of each location on a map, POS location, and car washes. Within the dashboard, there are widgets for each location: car count, current sales, cost of labour, number of employees, and sales by department. When you chose a widget, you can see a full detailed description for a specific period, for example: day, week or year.
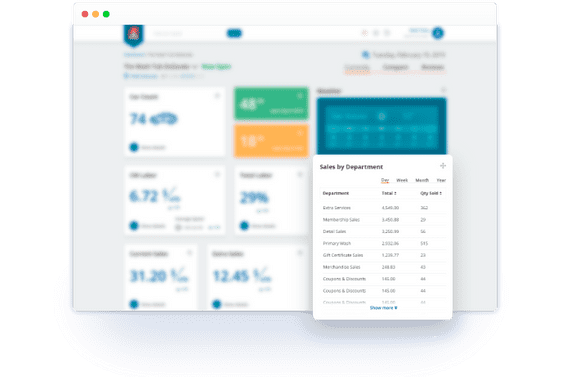
Site Dashboard
In this dashboard, there are two internal pages: current and comparison. The Current page has specific widgets that are similar in the Admin Dashboard. Once you choose a widget you can see detailed information of each location.
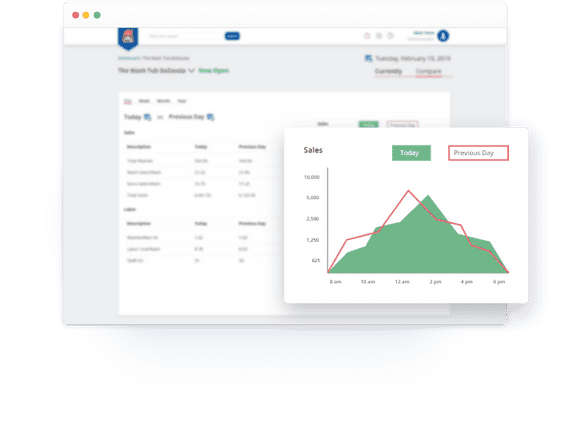
Comparison
The Comparison page is optional for Managers to compare sales and labor figures between locations with info-graphics. Again, you can retrieve detailed information for each location.


